
Carbon Dioxide (CO2)
Long-Term Annual Means with IPCC Scenarios
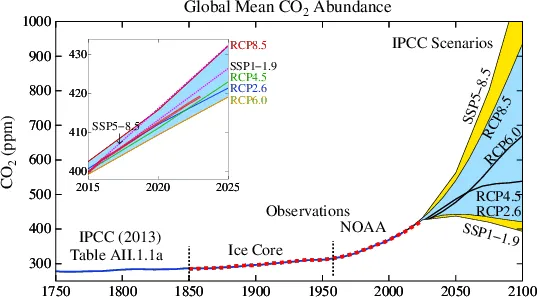
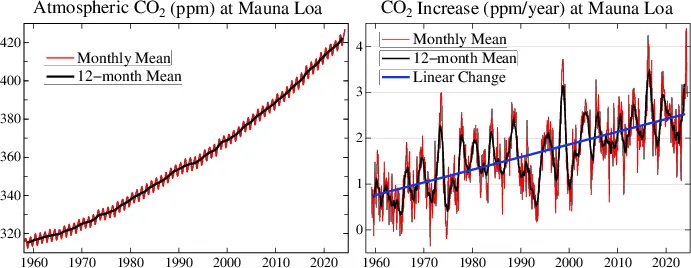
Figure in PDF (Data through May 2024, Last updated 2024/06/07)
Data Source: Dr. Xin Lan, NOAA/GML (gml.noaa.gov/ccgg/trends/) and Dr. Ralph Keeling, Scripps Institution of Oceanography (scrippsco2.ucsd.edu/) (https://gml.noaa.gov/ccgg/trends/data.html)
Recent Global CO2
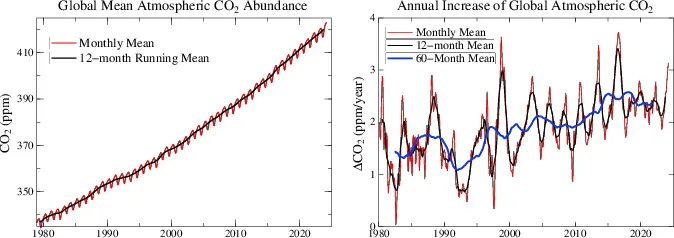
Figure in PDF (Data through March 2024, Last updated 2024/06/07)
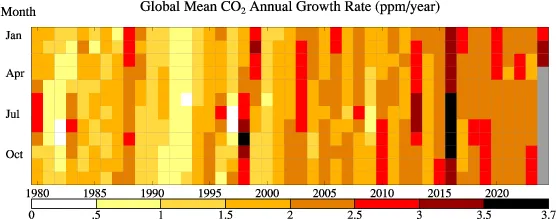
ERL (2013) Fig. 2 and PLOS ONE (2013) Fig. 6 Update
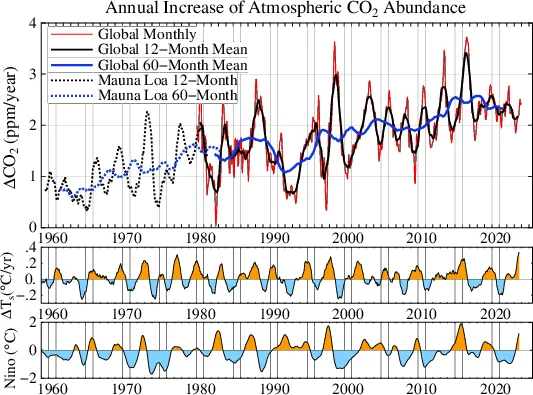
Annnual change of CO2 (globally since 1980 and at Mauna Loa before that) compared with the annual increase of the global mean surface temperature and Nino 3.4 temperature data. Figure in PDF (Data through December 2023, Last updated 2024/3/06)
"Burden" (2017) Fig. 6 Update
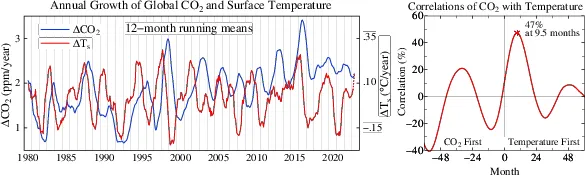
Left: Annnual change of CO2 (globa data through September 2023 and Mauna Loa data added for the last two months). Right: Correlation between the annual change of CO2 and annual change of the global mean surface temperature. The addition of 2 months at the end did not change the correlation. Figure in PDF (Last updated 2023/12/07)
CO2 Emissions and Airborne Fraction
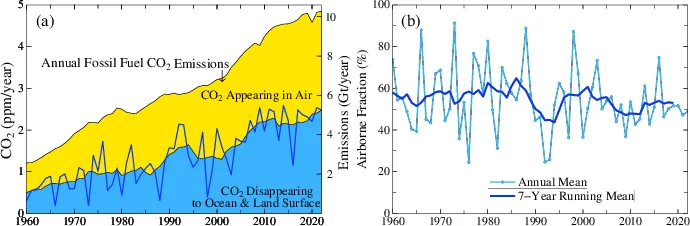
PDF, another version in PDF(***re-link) (last updated 2023/07/07)
Methane (CH4)
Long-Term Annual Means with IPCC Scenarios
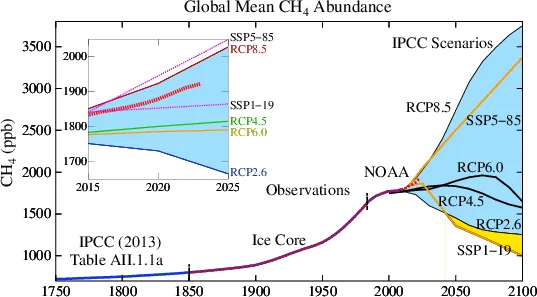
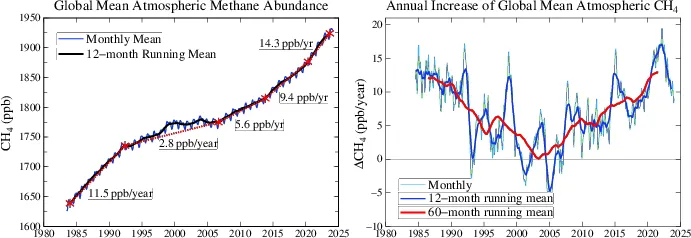
Figure in PDF (Data through February 2024, Last updated 2024/06/07)
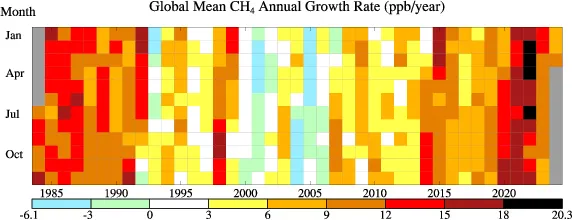
Data Source: Lan, X., K.W. Thoning, and E.J. Dlugokencky: Trends in globally-averaged CH4, N2O, and SF6 determined from NOAA Global Monitoring Laboratory measurements. Version 2023-06 (https://gml.noaa.gov/ccgg/trends_ch4//)
Nitrous Oxide (N2O)
Long-Term Annual Means with IPCC Scenarios
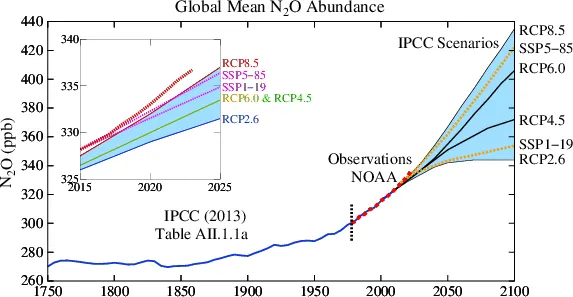
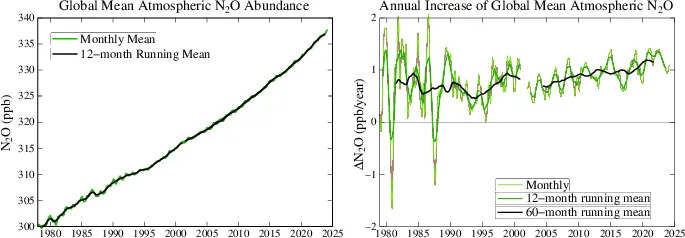
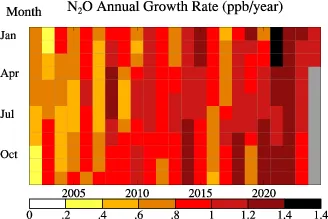
Figure in PDF (Data through March 2024, Last updated 2024/07/16)
Data Source: 1978-2000, NOAA/GMD Halocarbon Network. 2001-2021, Lan, X., K.W. Thoning, and E.J. Dlugokencky: Trends in globally-averaged CH4, N2O, and SF6 determined from NOAA Global Monitoring Laboratory measurements. Version 2023-06 (gml.noaa.gov/ccgg/trends_n2o)
Other Trace Gases
mixing ratios: 1900-1990(***re-link) (2016/07/02), 1992-2022 (2024/02/29), 2015-2100, Scenario A1B(***re-link) (2018/03/26).
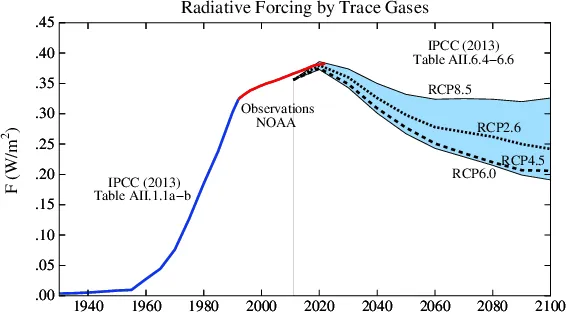
Figure in PDF. (Last modifies 2023/01/19)
forcings: 1900-1990(***re-link) (2016/07/09), 1992-2022 (2024/03/01), 2011-2100, RCP Scenarios (2023/01/19)
Recent Forcing and Its Growth
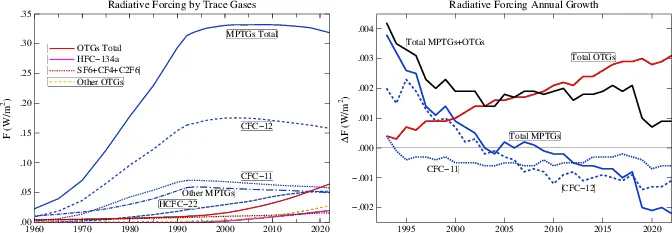
Figure in PDF (Data through 2022, Last updated 2024/03/01)
Data source: Dutton, G.S., B.D. Hall, S.A. Montzka, et al. NOAA ESRL HATS Total_Cl_Br, NOAA GMD HATS SF6 pages.
GHG Forcings
CO2 for various ranges PDF
by Doubling Abundance
CO2: 4.04 W/m2 (278 => 556 ppm),
CH4: 0.56 W/m2 (722 => 1444 ppb),
N2O: 0.87 W/m2 (270 => 540 ppb)
Greenhouse Gas Forcing Compared with Future Scenarios
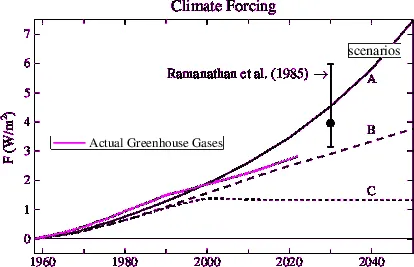
Figure also available in PDF. comparison of 1988 and Pipeline papers(***re-link). Data through 2022. (Last modified: 2024/01/18)
Digital data for Scenarios A, B and C. The original figure is Fig. 2 in Hansen, Fung, Lacis, et al. 1988, "Global Climate Changes as Forecast by Goddard Institute for Space Studies Three-Dimensional Model", JGR 93, 9341-9364.
Greenhouse Gas Forcing Growth Rates
IPCC RCP Scenarios. PDF(***re-link)
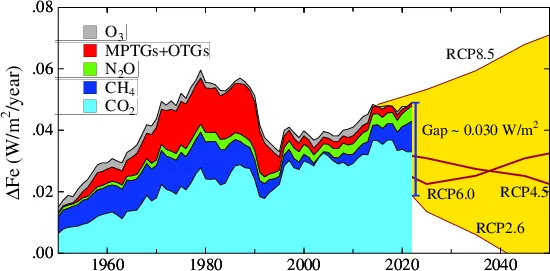
The curves are 5-year running means with 3-year mean for 2021 and annual mean for 2022.
Figure also available in PDF. (Last modified: 2023/05/20). The original figure is Fig. 4 in Hansen and Sato 2004, "Greenhouse gas growth rates" PNAS 101, 16109-16114.
The RCP2.6 scenario aims to limit the increase of the global mean temperature to 2oC.