Climate Data
Visit Climate Uncensored: updated climate data and figures
Explore updated graphics on global temperature, ENSO, Earth’s energy imbalance, greenhouse gases, solar irradiance, ice sheets, and other climate indicators.
Our aim is to help people understand global climate change — and how the factors that drive climate are changing.
We start with climate diagnostics — people are usually most interested in climate change itself. But cause-and-effect analysis requires also data on climate forcings (which drive climate change) and feedbacks (which amplify or diminish climate change).
We update graphs of "Storms of My Grandchildren." Yet the greatest insight about processes discussed in "Storms" is often provided by other quantities, for example, the rate of ice sheet disintegration. We include some data from other scientists or their web sites, as indicated.
Continual updating of data curves, whether global temperature, the Greenland ice sheet mass, the sun's brightness, Keeling's carbon dioxide record, or other more obscure quantities, is a most interesting aspect of science. Sometimes data curves follow an expected path, sometimes not, but we usually learn something. As Richard Feynman said, there is a pleasure of finding things out.
That pleasure is now mixed with concern. Humans are altering the measured curves. But whether climate change will be moderate — something humans and most species can adjust to — or whether climate change accelerates and spins out of control, with devastating consequences for future generations — that depends.
Future climate depends on how climate forcings change — human-made greenhouse gases, especially carbon dioxide, and forcings that are not yet well measured, especially aerosols. The speed and degree of climate change also will depend upon how fast amplifying feedbacks, such as Arctic sea ice, the large ice sheets, and methane hydrates come into play.
FEATURED UPDATED FIGURES
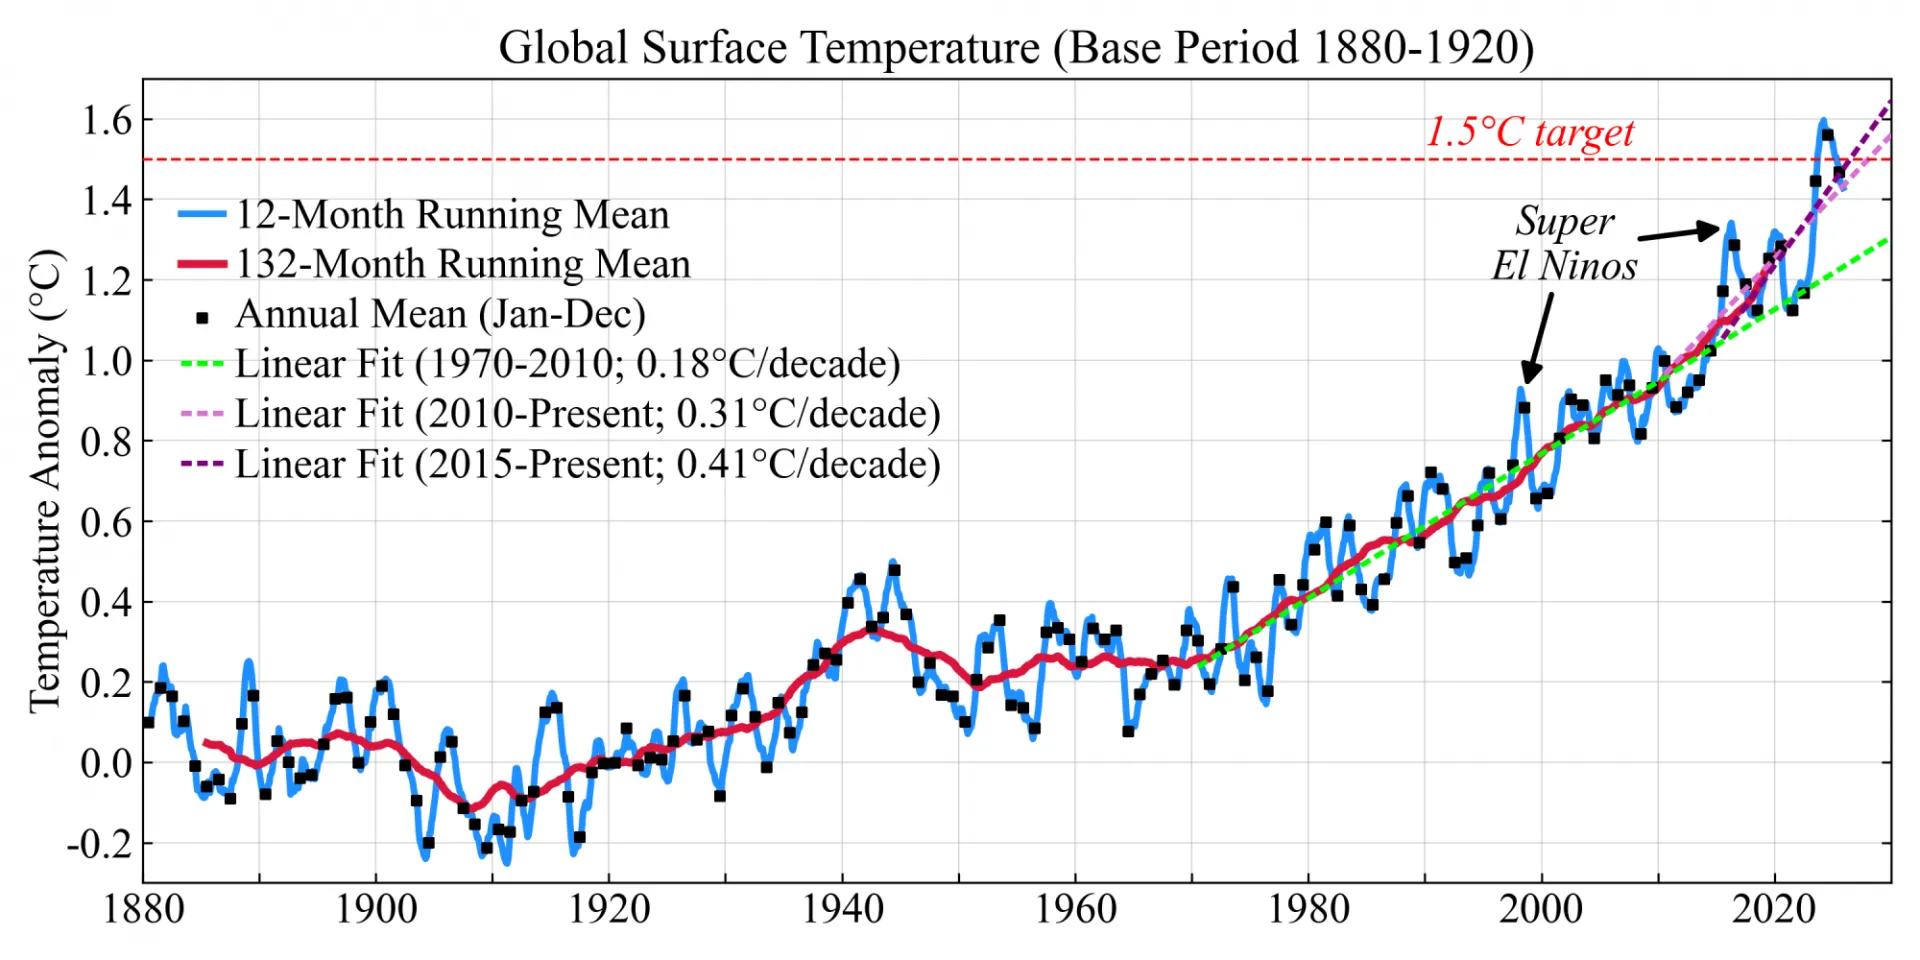
Global surface temperature. Global mean surface temperature anomaly relative to the 1880–1920 base period, showing annual means, 12-month and 132-month running means, and recent linear trends.
Data/source: NASA GISS temperature analysis. More: Climate Uncensored --- Temperature; "Global Warming Has Accelerated."
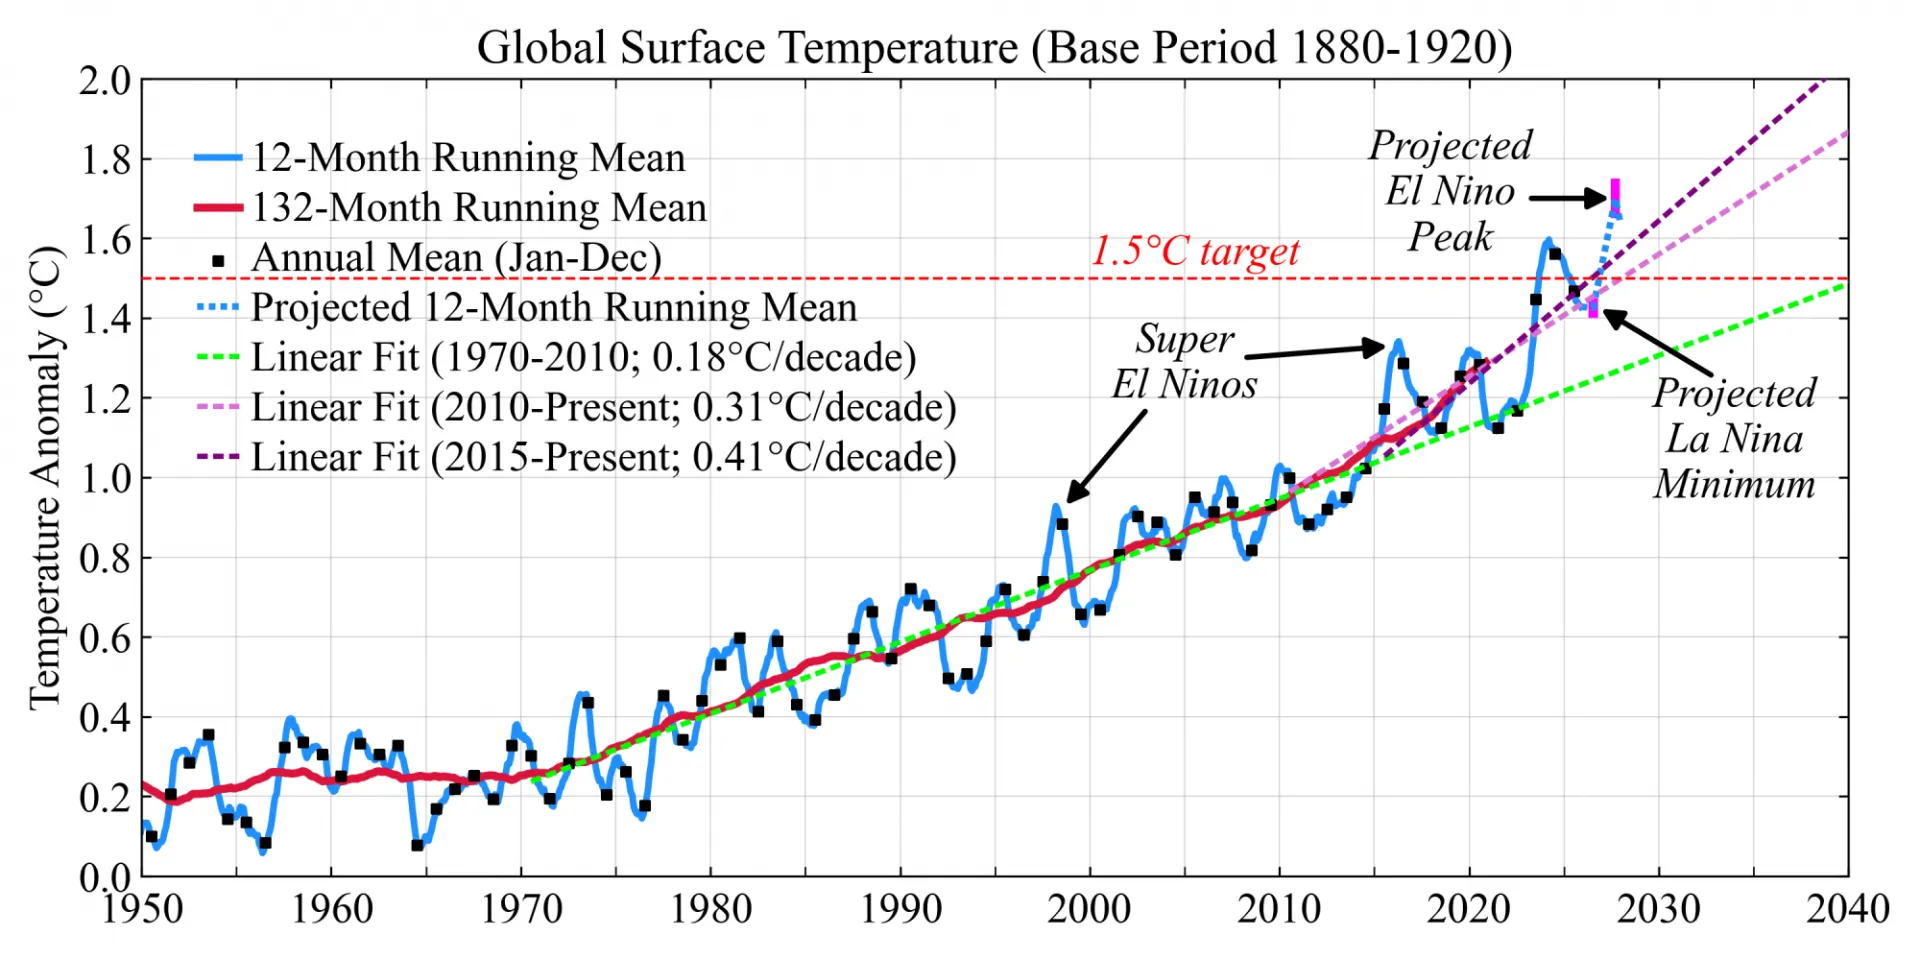
Global temperature and ENSO projections. Global mean surface temperature anomaly relative to the 1880–1920 base period, with observed annual means, running means, recent warming trends, and projected near-term ENSO-related temperature changes. Projections are based on the historical relationship between global temperature and the Nino3.4 index.
Data/source: NASA GISS Surface Temperature Analysis and NOAA Climate Prediction Center Nino3.4 index. More: Climate Uncensored --- Temperature; El Nino / La Nina; "Super El Nino? Super Warming is the Main Issue."
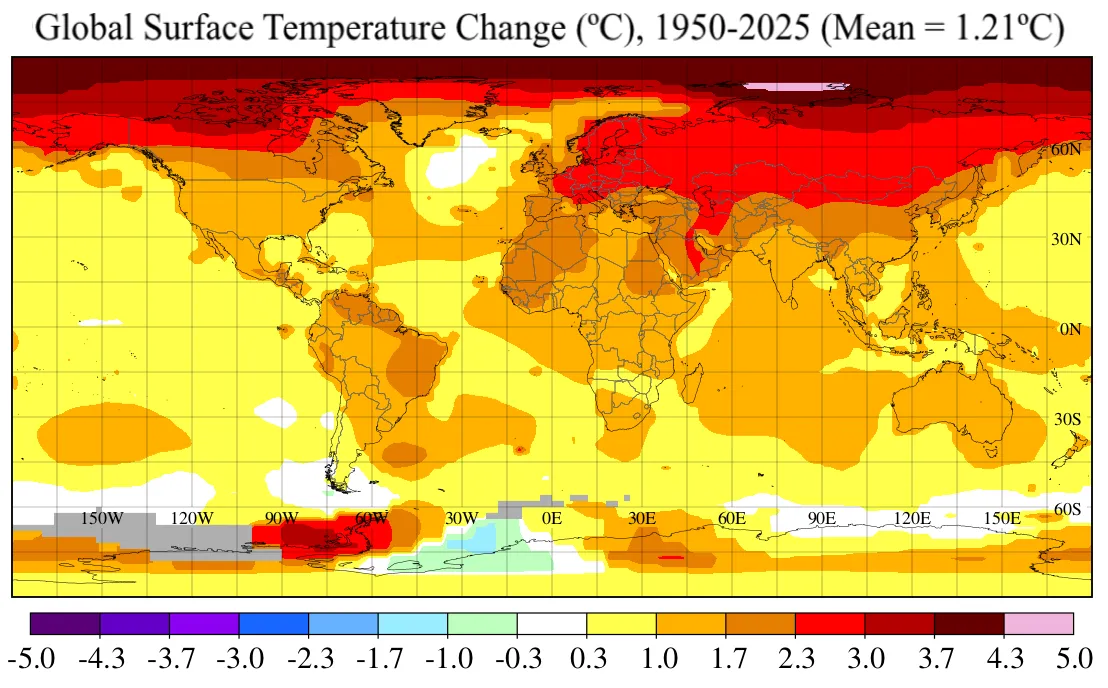
Surface temperature change. Global map of surface temperature change based on local linear trends from 1950–2025, showing the geographic pattern of recent warming.
Data/source: NASA GISS Surface Temperature Analysis. More: Climate Uncensored --- Temperature.
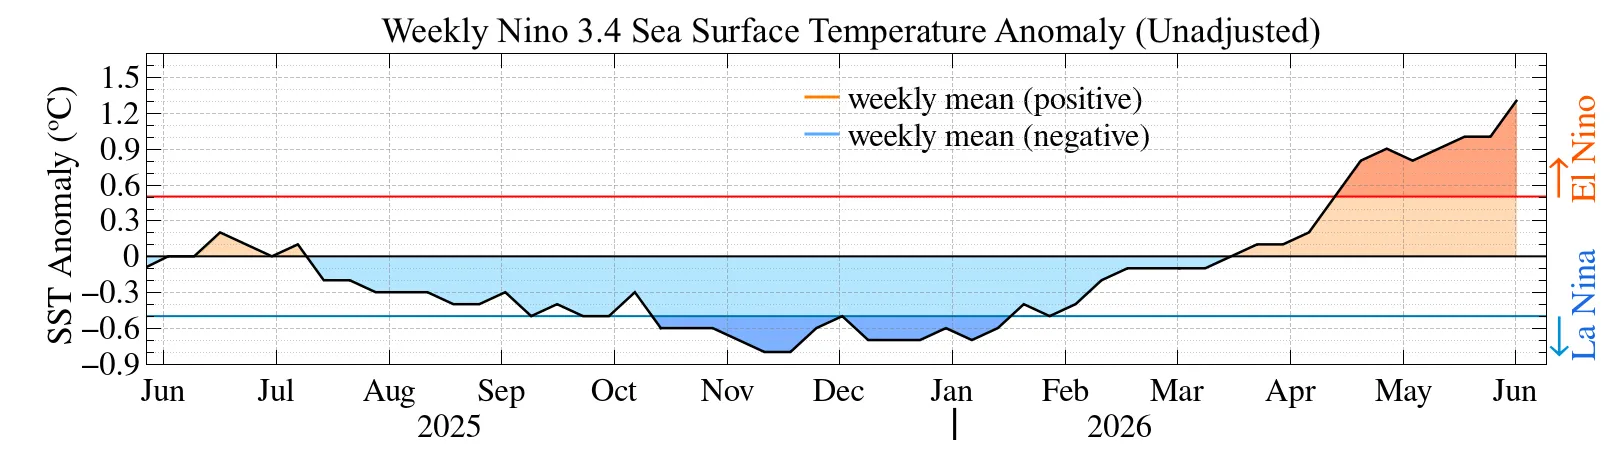
Recent ENSO conditions. Weekly Nino3.4 sea surface temperature anomaly, showing the current ENSO state in the central equatorial Pacific (28 May 2025 - 3 Jun 2026)
Data/source: NOAA Climate Prediction Center Nino3.4 index. More: Climate Uncensored --- El Nino / La Nina.
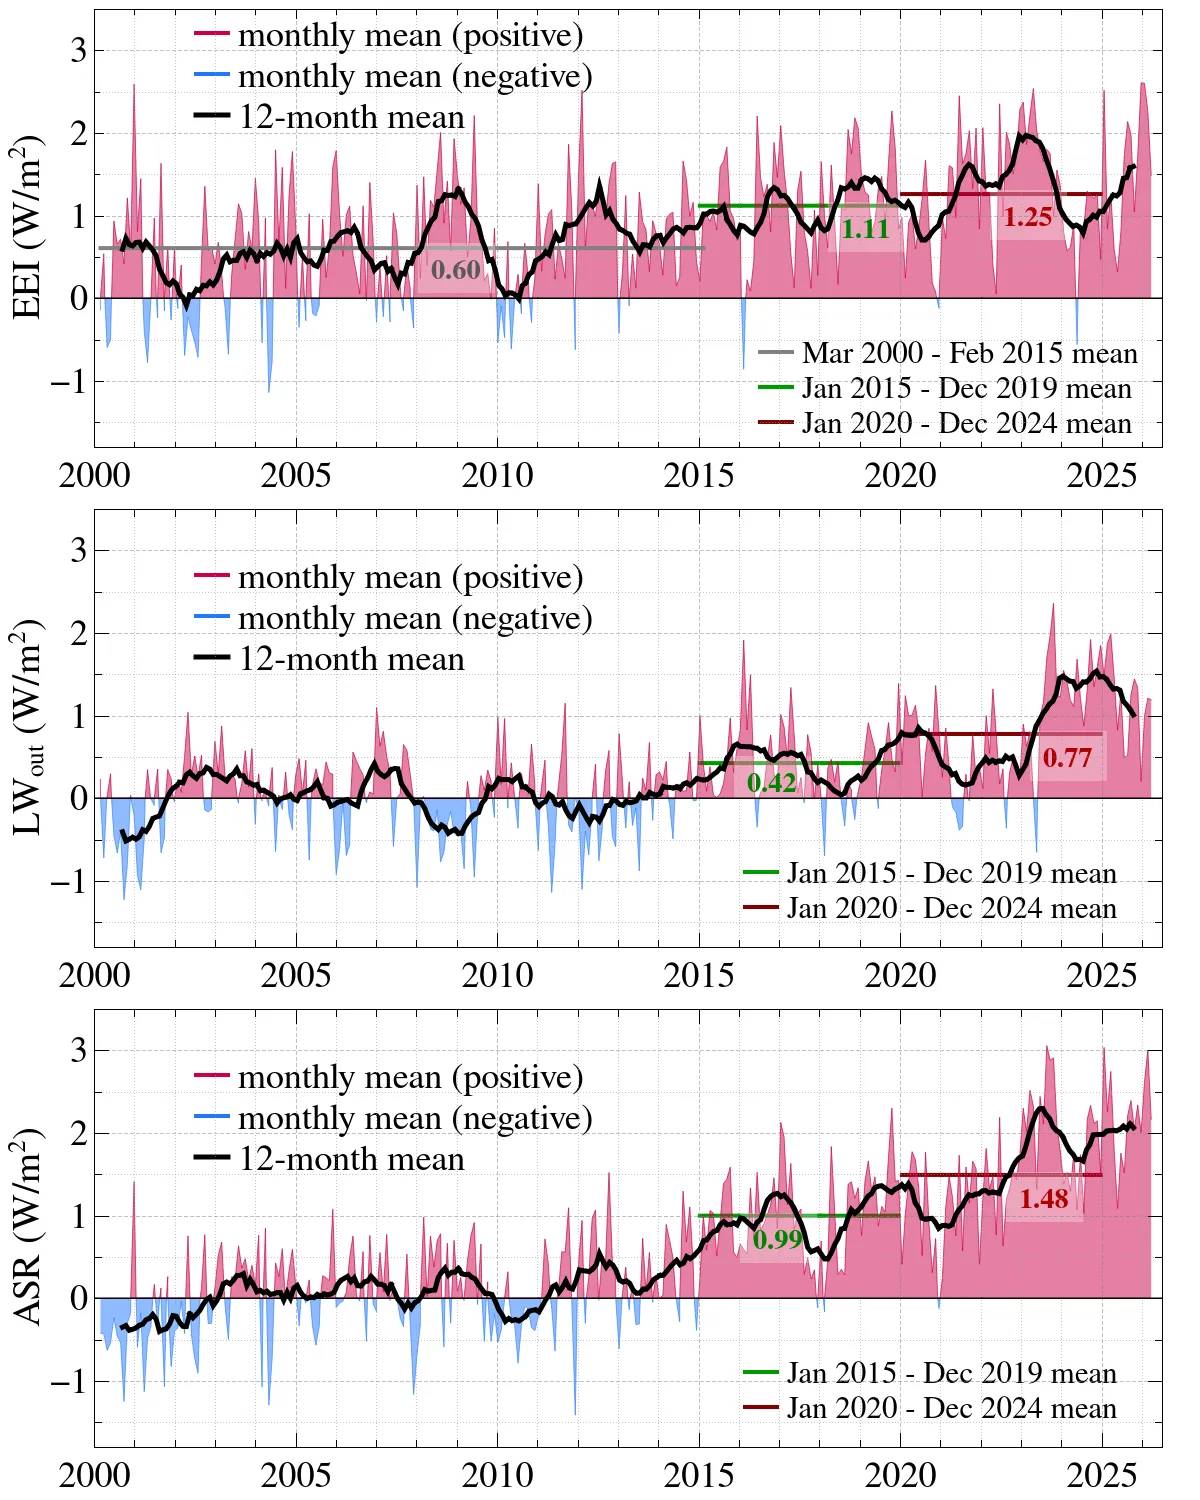
Earth’s energy balance. Absorbed solar radiation, outgoing longwave/emitted thermal radiation, and Earth’s energy imbalance, shown together to clarify the planetary energy-budget changes driving observed global warming.
Data/source: NASA Clouds and the Earth’s Radiant Energy System (CERES), EBAF-TOA dataset. More: Climate Uncensored; "Large Cloud Feedback Confirms High climate Sensitivity."
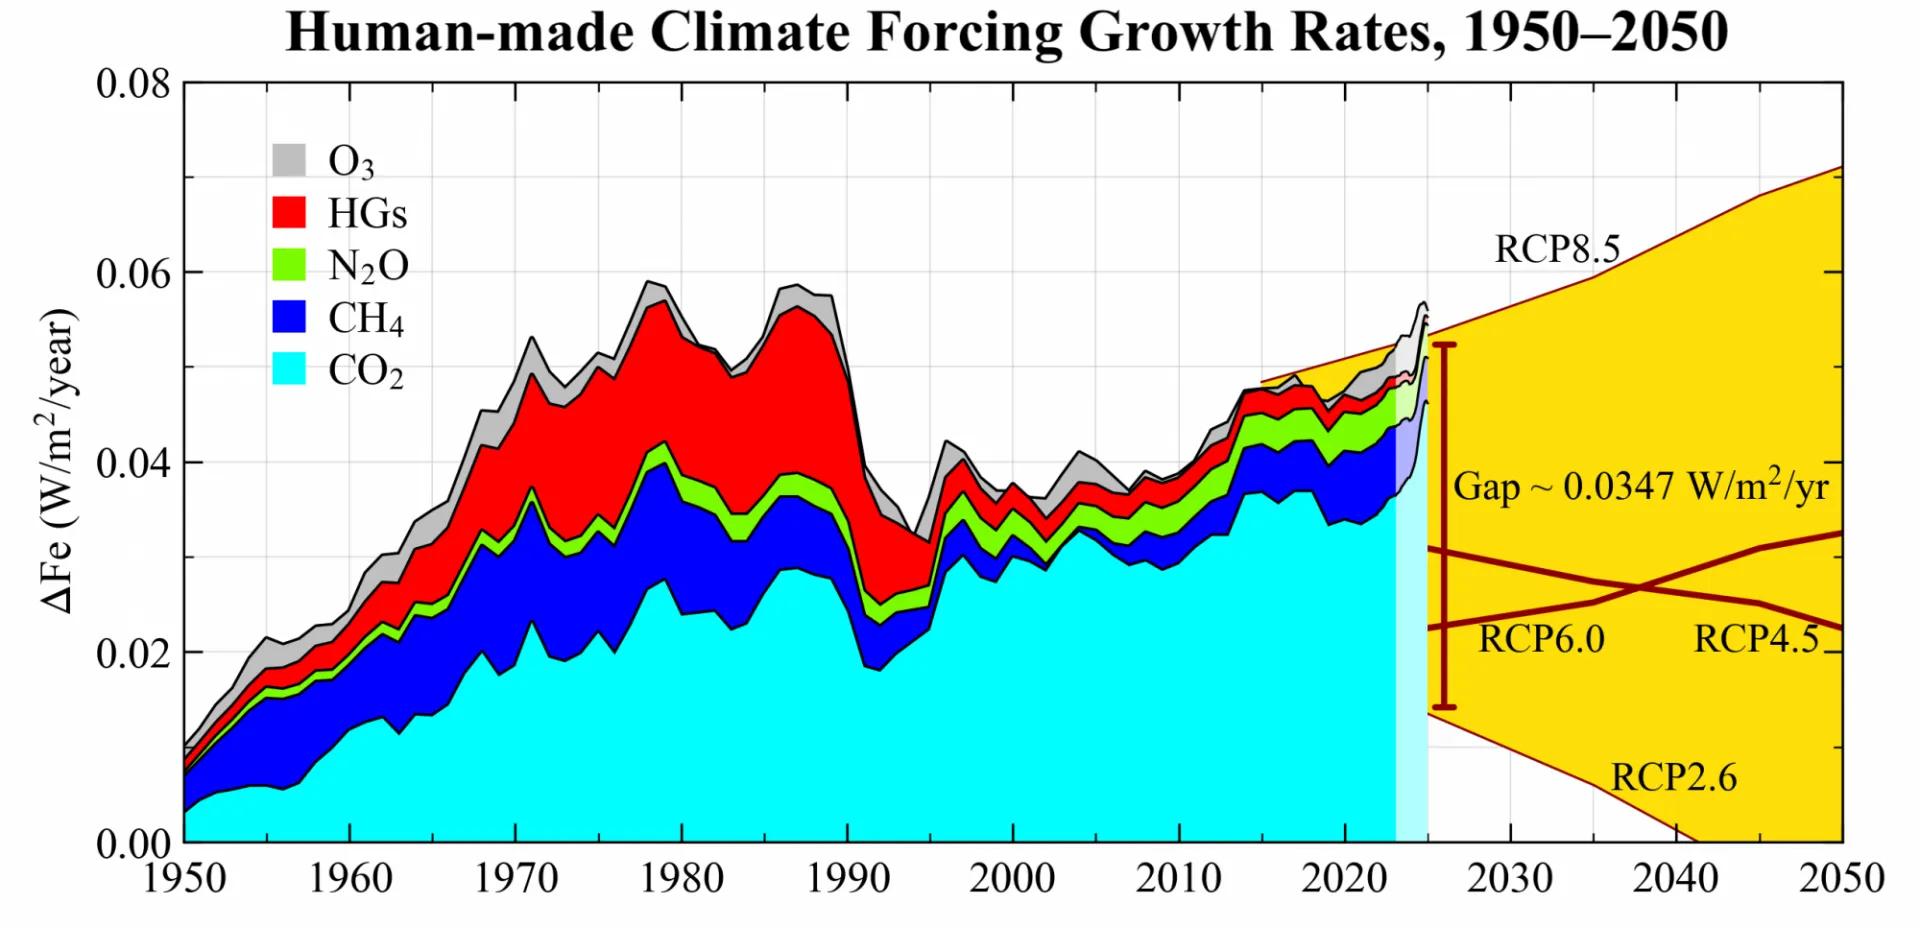
Greenhouse gas forcing growth rates. Growth rates of human-made climate forcings from carbon dioxide (CO₂), methane (CH₄), nitrous oxide (N₂O), halogenated gases (HGs), and ozone (O₃), compared with future forcing scenarios (RCPs).
More: Climate Uncensored --- Greenhouse Gases.