
Monthly and Annual Temperature Tables
1880-1920 Base Period
1951-1980 Base Period
Annual Mean Temperature Ranking (Top 10)
The top 10 warmest years were all in the past 10 years (2014-2023)
1880-1920 Base Period
1951-1980 Base Period
With 1880-1920 Base Period
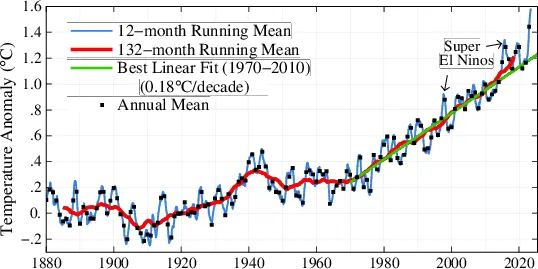
In this graph the base period is switched from our traditional 1951-1980 to 1880-1920 for the reasons given in "A Better Graph", but of course we continue to also produce our graphs with the 1951-1980 base period, as shown below. Data through June 2024 are used for computing the means. Figures in PDF. last modified 2024/07/10)
With Predictions Updated on 2024/06/11
With Current Trend Updated on 2024/06/26
With Our Traditional 1951-1980 Base Period from Here
Below are maps of the mean surface temperature anomaly for the past month, the past three months, and the past 12 months. Regional weather patterns, apparent on the monthly time scale, tend to disappear in averages over longer time scales.
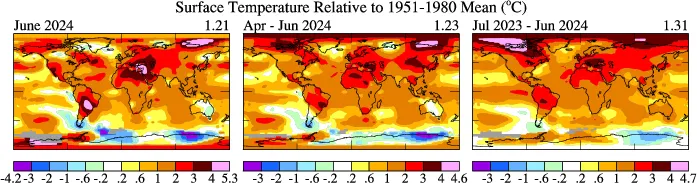
Also in PDF, last modified 2024/07/10.
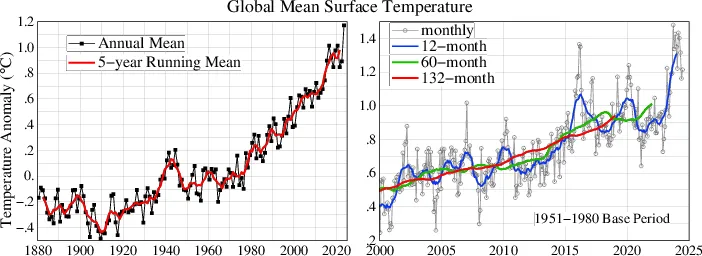
Also in PDF. Data through June 2024 are used for computing the means. (last modified 2024/07/10)
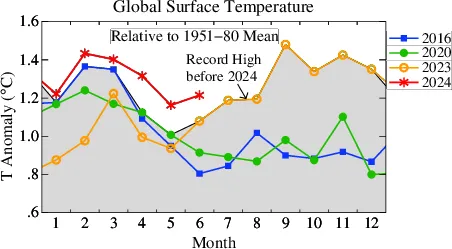
Comparison of temperature of a few years in recent past. Figure also available in PDF (Updated on 2024/07/10)
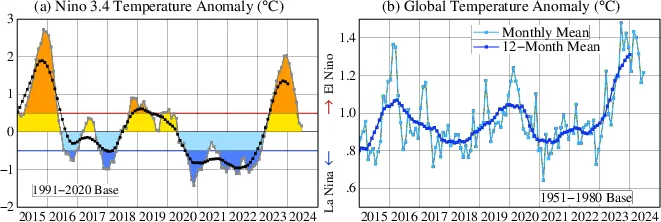
Comparison of El Nino/La Nina phase and the global mean temperature change. Figure also available in PDF (Updated on 2024/07/10)
Additional figures are on More Figures page
Data Source
NASA GISS temperature web pages which uses NOAA GHCN v4 (meteorological stations) and ERSST v5 (ocean areas)